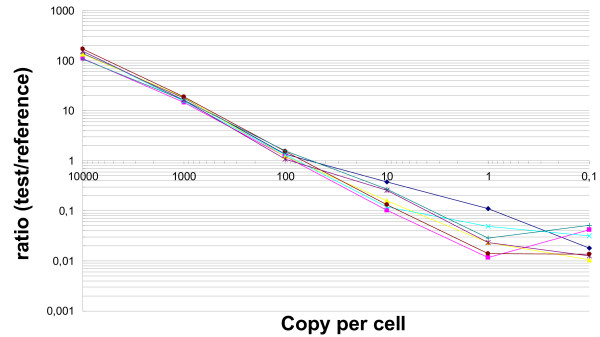
Figure 3.
Dose-response curve for the Actichip array. Each individual A. thaliana spike mix was compared directly to the reference mix, resulting in seven hybridisations. For each hybridisation series, the raw signals were pre-processed according to the procedure detailed in the Methods section. Array data were normalised using a median Log2 ratio-centring approach after subtraction of the local median background intensity from the median foreground intensity. The normalised Log2 ratios were averaged over 3 replicates, and the final ratio was computed as the exponential base 2 of this average. The abscissa indicates the spike RNA abundance expressed as copy per cell (cpc) in the seven spike mixes. The ordinate shows the resulting normalised intensity ratios relative to the reference mix (all spikes at a concentration of 100 cpc). The data are mean values from three independent experiments.

