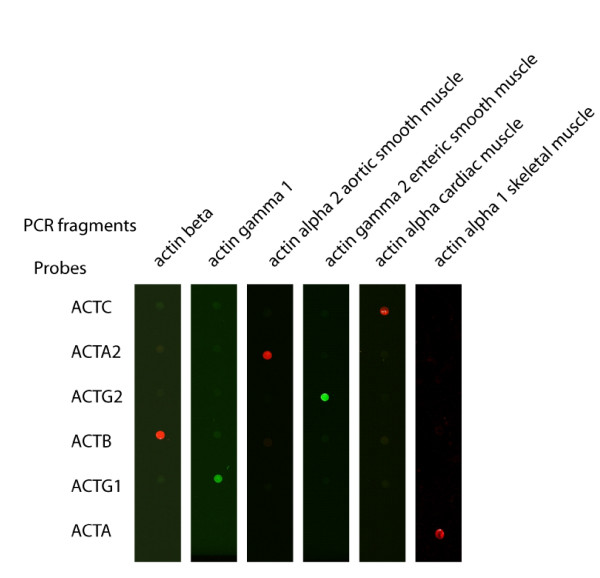
Figure 4.
Discrimination of the actin isoforms by Actichip. PCR fragments corresponding to the six actin isoforms were generated from cDNA and were fluorescently labeled. The figure shows the images resulting from the specific hybridisations of the PCR fragments onto independent Actichip arrays. ACTC1: Actin, alpha, cardiac muscle 1; ACTA2: Actin, alpha 2, smooth muscle, aorta; ACTG2: Actin, gamma 2, smooth muscle, enteric; ACTB: Actin, beta; ACTG1: Actin, gamma 1; ACTA1 Actin, alpha 1, skeletal muscle.

