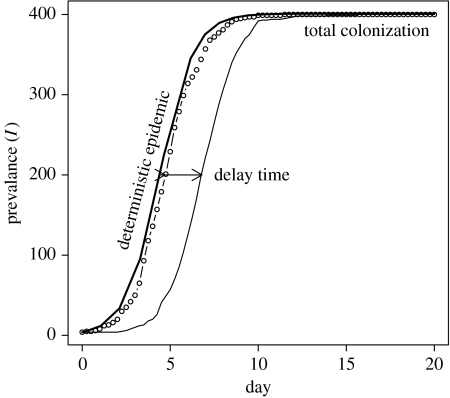
Figure 1.
Stochastic SI model. Two stochastic replicates of SI model (with N=400 and I(0)=4) demonstrating variation in delay times and similarity of epidemic phases. Note that, although increasingly unlikely, the delay time could be arbitrarily large with no extinction of the pathogen (β=1.04 contacts per day; parameters from Van Gerwe et al. 2005).

