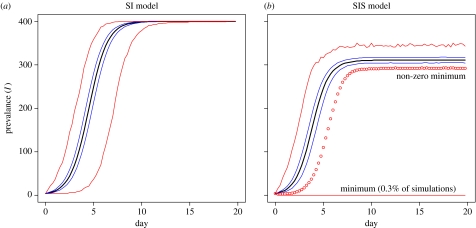
Figure 2.
Effect of clearance on epidemic curve. (a) SI model (β=1.04 contacts per day, N=400, I(0)=4, parameters from Van Gerwe et al. 2005). (b) SIS model (β=1.5 contacts per day, clearance rate α=1/3 per day). The transmission rate of the SIS model was adjusted to match the (median) attack of the epidemic phase. Despite the high clearance rate, there is little change to the delay time in the SIS model and a major (easily detectable) reduction in prevalence. For both models, the envelopes of the ‘five number’ summaries of 10 000 replicates of the stochastic model are plotted. Bold black lines indicate the median, blue lines the upper and lower quartiles and red lines the maximum and minimum. For the SIS model, 0.3% of simulations result in no epidemic taking place, lower values of I(0) would result in a higher probability of this occurring.

