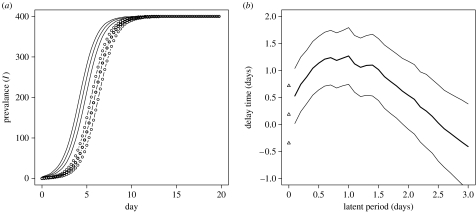
Figure 3.
Effect of latent period on delay time. (a) Inclusion of a latent period of 1 day (open circles) leads to a significant increase in the delay time as compared with the simple epidemic (SI) model (solid lines). The median (bold) and envelopes of the upper and lower quartiles from 10 000 replicates of the stochastic model are plotted. (b) Delay time, measured as the difference in the time to reach the midpoint of the epidemic between the stochastic model (with latent period) and the deterministic SI model, plotted against latent period. Correcting the transmission rate in order to match the maximum growth rate of the simple epidemic (SI) model places a limit on the extent to which the delay time can be increased and still be consistent with the experimental data. Bold line represents the mean delay time, fine lines the envelope created by the standard deviations about the mean calculated over 10 000 stochastic replicates. Triangles indicate the mean and envelope of delay time for the stochastic SI model (without latent period).

