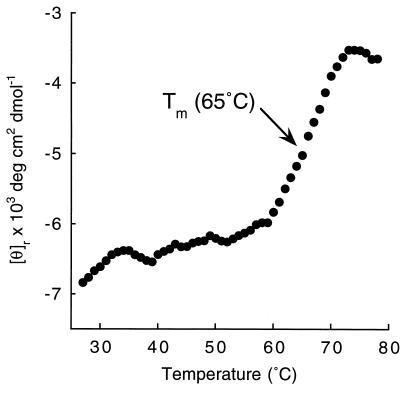
Figure 4.
Thermal denaturation profile of serum ZAG. The CD signal at 223 nm is plotted as molar ellipticity per mean residue after smoothing. Similar profiles were obtained using ZAG isolated from cyst fluid. Thermal denaturation studies were repeated after denaturation and dialysis to remove any potential ZAG ligands without any effect on the denaturation profile.

