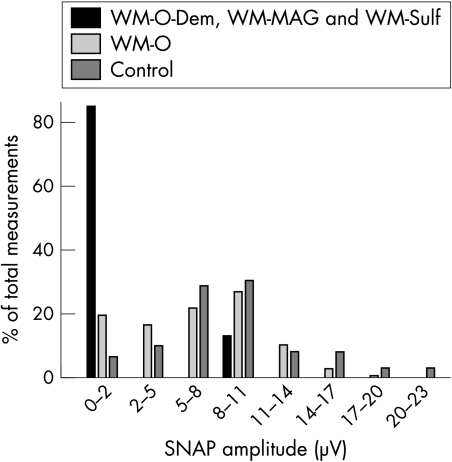
Figure 1 Distribution of SNAP amplitudes in WM subgroups and controls. SNAP amplitudes in the combined group of WM‐S, WM‐MAG, and WM‐O‐Dem showed more frequent severe axon loss compared with WM‐O patients and controls. The entire distribution of SNAP amplitudes in WM‐O patients was moderately skewed to the left toward reduced levels compared with controls. There were fewer WM‐O patients with higher amplitudes SNAPs and more with lower amplitude SNAPs.

An official website of the United States government
Here's how you know
Official websites use .gov
A
.gov website belongs to an official
government organization in the United States.
Secure .gov websites use HTTPS
A lock (
) or https:// means you've safely
connected to the .gov website. Share sensitive
information only on official, secure websites.
