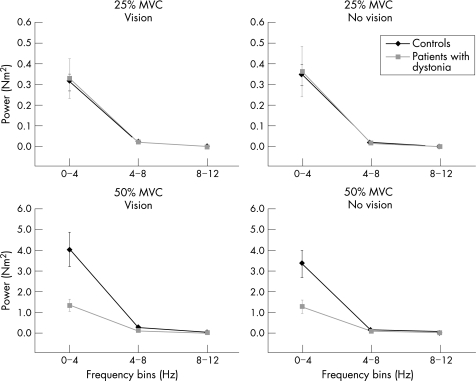
Figure 4 Average spectral power of the force signal for the 25%‐maximum voluntary contraction (MVC; top panels) and 50%‐MVC force target (bottom panels) under conditions of vision (left panels) and no vision (right panels) in the 0–4‐Hz, 4–8‐Hz and 8–12‐Hz frequency bins. Controls are shown as black lines and diamonds and patients with dystonia as grey lines and squares. Values are mean (SE). The scale of the y axis is different at the different force targets.

An official website of the United States government
Here's how you know
Official websites use .gov
A
.gov website belongs to an official
government organization in the United States.
Secure .gov websites use HTTPS
A lock (
) or https:// means you've safely
connected to the .gov website. Share sensitive
information only on official, secure websites.
