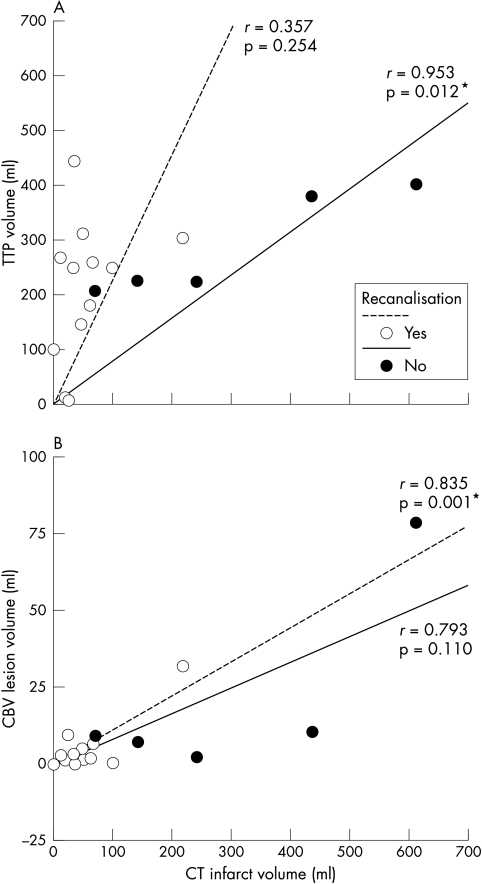
Figure 1 Relation between recanalisation, final infarct volume on computed tomography, and initial lesion volumes defined by prolonged time to peak (TTP) (panel A); and decreased cerebral blood volume (CBV) (panel B). Fitted linear correlation lines and Pearson's moment correlation coefficient (r) are shown for each group.

An official website of the United States government
Here's how you know
Official websites use .gov
A
.gov website belongs to an official
government organization in the United States.
Secure .gov websites use HTTPS
A lock (
) or https:// means you've safely
connected to the .gov website. Share sensitive
information only on official, secure websites.
