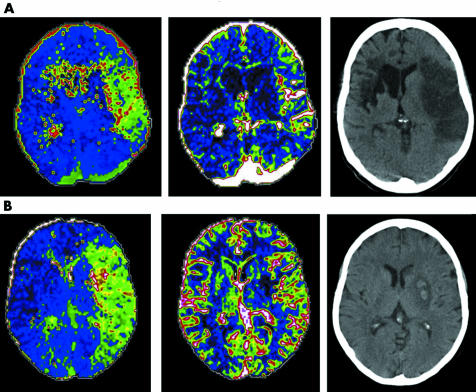
Figure 2 Examples of (A) no recanalisation (despite intravenous rtPA) and (B) recanalisation (with rtPA). Images shown represent (from left to right) initial time to peak (TTP), initial cerebral blood volume (CBV), and final computed tomography (CT). The subject shown in panel A had an old contralateral cerebral infarct, and the subject in panel B had haemorrhagic transformation associated with the infarct.

An official website of the United States government
Here's how you know
Official websites use .gov
A
.gov website belongs to an official
government organization in the United States.
Secure .gov websites use HTTPS
A lock (
) or https:// means you've safely
connected to the .gov website. Share sensitive
information only on official, secure websites.
