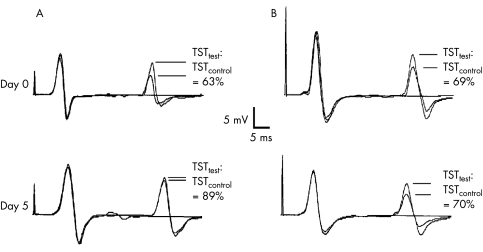
Figure 2 Triple stimulation technique (TST) recordings of a patient with relapsing‐remitting multiple sclerosis (RR‐MS) (A) and with primary progressive multiple sclerosis (PP‐MS) (B), the upper row showing the recordings at day 0, the lower row at day 5. For all recordings, the best TSTtest curve, the TSTcontrol curve, and a baseline curve (obtained by supramaximal stimulation of the tibial nerve at the ankle) were superimposed. The sweep of the traces is delayed and starts with the second stimulus of the TST (electrical stimulation at the ankle). The TST amplitude ratio, calculated by TSTtest:TSTcontrol, is given for each recording. In the RR‐MS patient, there is a clear increase in TST amplitude ratio at day 5 resulting in normalisation of the ratio, whereas it remains reduced and virtually unchanged in the PP‐MS patient. The central motor conduction time (CMCT), obtained by conventional motor evoked potentials (not shown), was normal in RR‐MS (day 0 = 13.9 ms, day 5 = 13.5 ms), but prolonged in PP‐MS (day 0 = 19.2 ms, day 5 = 16.8 ms). Overall the changes in CMCT did not reach significance in any multiple sclerosis group, although there was a clear decrease in CMCT in some patients, as shown here for PP‐MS. Note that the distance between the two negative deflections of the TST recording does not directly reflect CMCT, but depends on the individually calculated delay I and II.

An official website of the United States government
Here's how you know
Official websites use .gov
A
.gov website belongs to an official
government organization in the United States.
Secure .gov websites use HTTPS
A lock (
) or https:// means you've safely
connected to the .gov website. Share sensitive
information only on official, secure websites.
