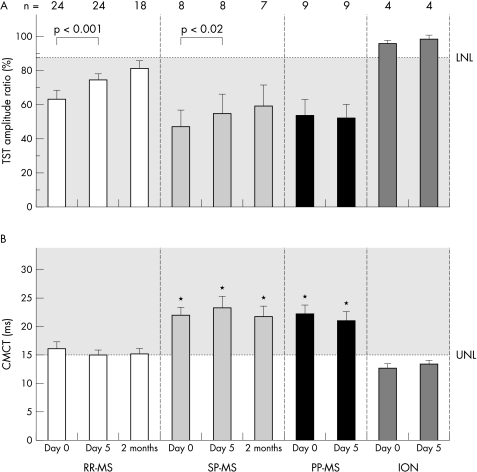
Figure 3 Mean triple stimulation technique (TST) amplitude ratio (A) and mean central motor conduction time (CMCT) (B) are shown separately for the different patient groups before (day 0) and after intravenous methylprednisolone (IVMP) (day 5 and 2 months). Error bars represent SEM. The dashed line indicates the lower normal limit (LNL = 88.4%) for the TST amplitude ratio and the upper normal limit (UNL = 15.1 ms) for the CMCT, respectively. Significant changes after IVMP are indicated by brackets and the appropriate p value (Wilcoxon signed rank test) on the top of the diagram. For RR‐MS and SP‐MS a significant increase in TST amplitude ratio was found from days 0 to 5. From day 5 to the 2 months follow up, a small but non‐significant increase in TST amplitude ratio occurred in the RR‐MS and SP‐MS groups (the number of available patients is indicated in the headline of the diagram); the number of available PP‐MS patients at 2 months was too small for statistical analysis. There was no significant change in CMCT for any patient group at any time point. Note that the mean CMCT of SP‐MS and PP‐MS was always significantly prolonged compared with RR‐MS (indicated by *). ION, isolated optic neuritis; PP‐MS, primary progressive multiple sclerosis; RR‐MS, relapsing‐remitting multiple sclerosis; SP‐MS, secondary progressive multiple sclerosis.

An official website of the United States government
Here's how you know
Official websites use .gov
A
.gov website belongs to an official
government organization in the United States.
Secure .gov websites use HTTPS
A lock (
) or https:// means you've safely
connected to the .gov website. Share sensitive
information only on official, secure websites.
