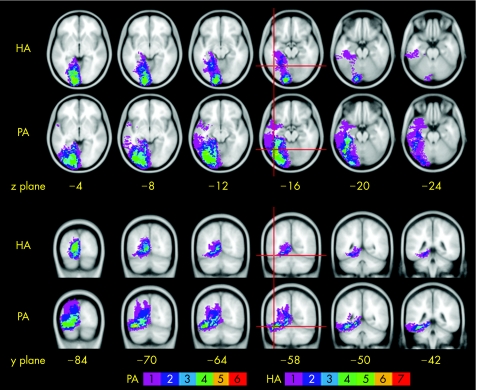
Figure 2 Lesion overlap maps in the axial (top two rows) and coronal (bottom two rows) planes. The anatomically normalised lesions are overlaid on a standard magnetic resonance image template, the mean from 152 normal subjects normalised into standard stereotactic space, available in SPM99. The template is orientated around the plane of the anterior and posterior commissures. The distance on the axial images is in millimetres above (positive) and below (negative) this plane, and that in the coronal images is the distance behind the anterior commissure. The voxels are colour coded to indicate how many patients had that region included within their lesion (see scale). The red cross‐hairs indicate the voxel at the centre of the so‐called “visual word form area” identified from a meta‐analysis of 27 functional imaging studies of reading in normal subjects (coordinates in standard stereotactic space: x = −44, y = −58, z = −15).18. HA, hemianopic alexia; PA, pure alexia.

An official website of the United States government
Here's how you know
Official websites use .gov
A
.gov website belongs to an official
government organization in the United States.
Secure .gov websites use HTTPS
A lock (
) or https:// means you've safely
connected to the .gov website. Share sensitive
information only on official, secure websites.
