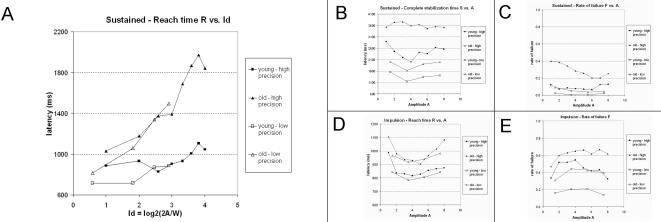
Figure 3. Performance indicators as functions of Amplitude and Precision.
Each dot represents the average performance of one group (young, aged) for a combination of amplitude and precision. Each graph contains four curves, one per combination of Age and Precision. A: reach time R in the sustained modality. B: complete stabilization time S in the sustained modality. C: rate of failure F in the sustained modality. D: reach time R in the impulsion modality. E: rate of failure in the impulsion modality. Note that the horizontal scale for the reach time in the sustained modality (A) is Fitts' index of difficulty Id = log2(2A/W). This depicts how the curves in high and low precision can be fitted by a regression line. For the remainder (B, C, D, E), the horizontal scale is the amplitude.

