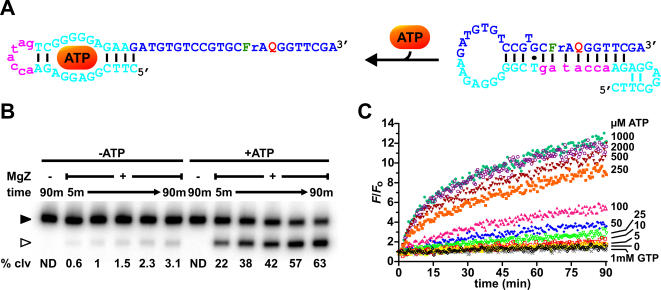
Figure 4. ATP sensor.
(A) ATP-ASAP. (B) Phosphorimage of the radioactive cleavage assays. Cleavage reactions were carried out with 5 nM ATP-ASAP, 50 nM MgZ and 1 mM ATP (in the case of ATP-induced cleavage) in 50 mM HEPES (pH 7.0), 20 mM MgCl2, 0.001% Tween-20 at room temperature. m, minutes; % clv, % cleavage; ND, not detectable; ▸, substrate; ▹, 5′ cleavage fragment. (C) Fluorescence kinetics in response to various concentrations of ligands. Similar reaction conditions in panel B were applied.

