
Figure 4. Activation of muscle bundles by ICC.
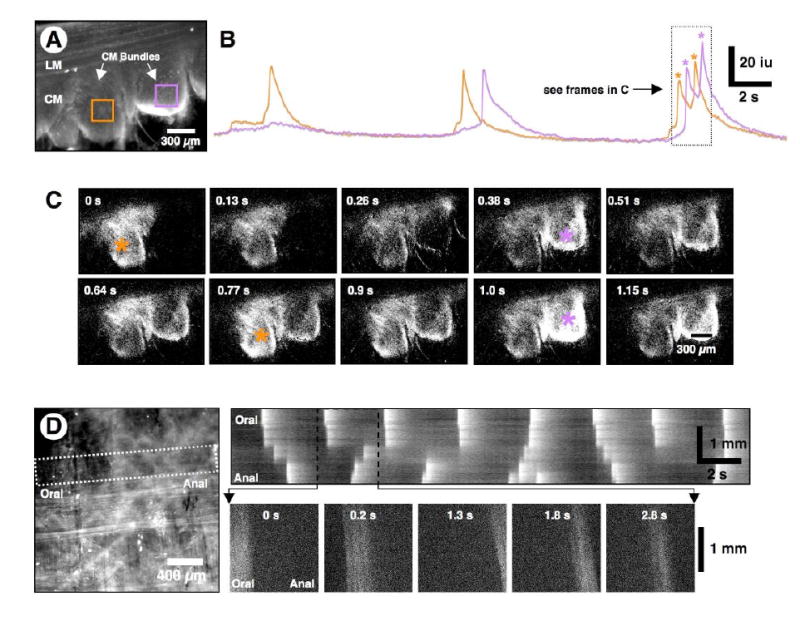
(A) Average Ca2+ florescence in cross-sectional preparation. Two ROIs were selected on adjacent CM bundles (orange and purple squares). (B) Line traces of fluorescence within the muscle ROIs show that the Ca2+ transients occurred in phase with the pacemaker cycle but were slightly out of phase in the two ROIs relative to each other (see 2nd and 3rd cycles). (C) The frames correspond to activity in the two ROIs designated in A during the final complex Ca2+ transients shown in the line traces in B (i.e., during the period designated by the dotted rectangle). Note that Ca2+ transients in the bundles showed temporal overlap, but the peaks of the transients were out of phase. The peaks of maximum activity in each bundle (orange and purple *) corresponds to the peaks of each Ca2+ transient. (D) A flat-sheet preparation from which most of the LM had been dissected away showed a network of ICC-MY lying upon the CM. The CM bundles are orientated in the vertical direction in this preparation. An ST map, constructed from the white dotted rectangle orientated across the CM bundles, shows disordered propagation of activity across CM bundles within the FOV. Note the “step-like” propagation (see 1st cycle), and incomplete propagation (2nd cycle). The lower frames (0 to 2.8 s) show the actual Ca2+ fluorescence in individual bundles across the FOV (see expanded black dotted region in the ST map). Note that each CM bundle, which runs top to bottom, was evenly illuminated when active.