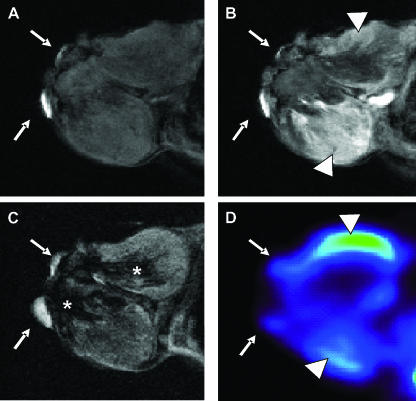
Figure 4.
Mapping of perfusion and metabolic pattern on spontaneous carcinomas. Precontrast (A), early postcontrast (B), T2-weighted (C), and FDG-PET (D) corresponding sections of a spontaneous breast carcinoma. External reference points (white arrows) were used to obtain better alignment between MRI and PET scan. A large hemorrhagic necrotic area was appreciable in a T2 image (asterisks), which did not enhance on postcontrast MRI and did not take up FDG. Viable tumor tissues evidenced areas of higher and lower FDG consumption (arrowhead) revealing, respectively, lower and higher Gd-DTPA enhancement.

