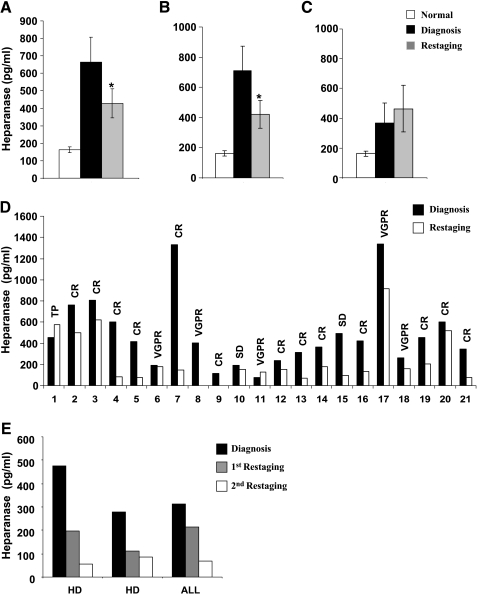
Figure 2.
Elevation of heparanase levels in the plasma of pediatric cancer patients. (A) Plasma samples were collected from 64 pediatric patients with various malignancies at (■) diagnosis and ( ) restaging, following the recommended antitumor treatment, and heparanase levels were quantified by the ELISA method, as described above. Average heparanase levels are also shown for the subgroups of patients that were diagnosed (B) to undergo CR or (C) to exhibit TP. (D) Representative heparanase levels at (■) diagnosis and (□) restaging are shown individually for 21 patients. (E) For two HD and one acute lymphoblastic leukemia patients, plasma samples were available at (■) diagnosis, (
 ) restaging, and (□) follow-up. CR, complete remission; TP, tumor progression; VGPR, very good partial remission; SD, stable disease.

