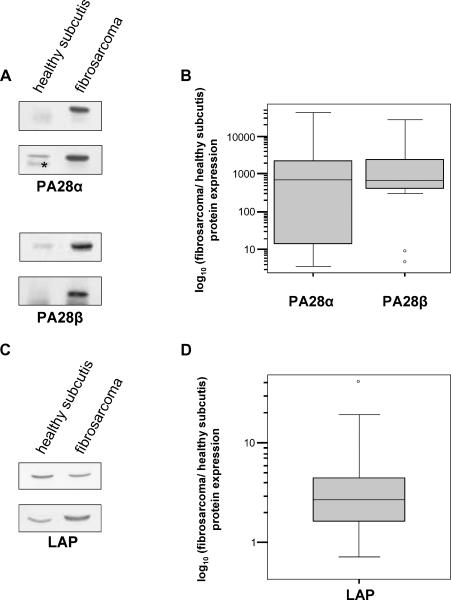
Figure 2.
Expression of PA28α/β and LAP in 18 fibrosarcomas and healthy control subcutis. (A) Two representative Western blot analyses for PA28α and two representative Western blot analyses for PA28β are shown. (B) Box plots of the expression ratios of PA28α/β between fibrosarcomas and healthy subcutis, determined as reported in Materials and Methods. *Nonspecific band. (C) Two representative Western blot analyses for LAP are shown. (D) Box plots of the expression ratios of LAP between fibrosarcomas and healthy subcutis.

