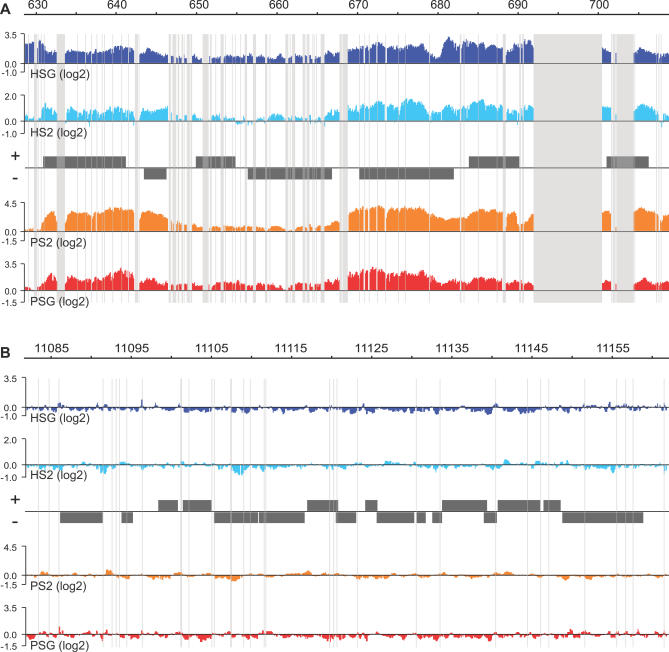
Figure 1. High Resolution ChIP-chip Analysis of POF and HP1 Binding to Chromosomes 4 and 2L in S2 Cells and Salivary Glands.
The smoothed data for one of the three biological replicates of each experiment are shown. Figure S1 shows a comparison of the replicates and the effect of the smoothing process. A typical 80-kb region from the fourth chromosome (A) is compared to a typical 80-kb control region from Chromosome 2L (B). The scale bars show the genomic positions of the two regions in kb. HP1 enrichment in salivary glands is shown in dark blue (HSG), HP1 in S2 cells (HS2) in light blue, POF in S2 cells (PS2) in orange, and POF in salivary glands (PSG) in red. The enrichments are the log2 ratios between specific IP/input. Genes expressed from left to right are shown above the horizontal line in each panel, and the genes expressed in the opposite direction are shown below the line. Regions that are repeat-masked and therefore not represented by probes on the arrays are shaded. Note that the fourth chromosome is enriched in repeated regions.

