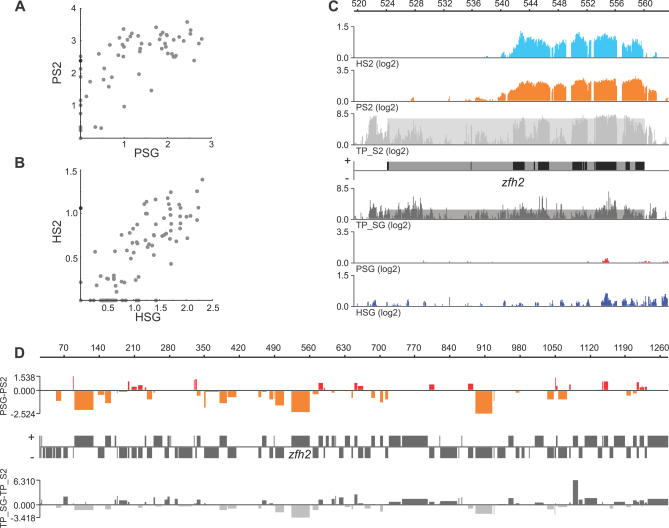
Figure 5. Cell-Specific Binding of POF and HP1 Is Linked to Levels of Transcription.
Relative binding values for POF (A) and HP1 (B) for Chromosome 4 genes in S2 cells versus salivary glands. The zfh2 gene is indicated as a black dot.
(C) POF and HP1 enrichments at the zfh2 locus in S2 cells and salivary glands. The transcript profiles on a log2 scale in S2 cells (light gray) and salivary glands (dark gray). The shaded boxes indicate the calculated expression values for zfh2 in the two cell types.
(D) The log2 differences in POF binding and differences in expression between salivary gland cells and S2 cells plotted with respect to the positions of the genes along the fourth chromosome. Genes with higher binding levels in salivary glands are shown as red bars above the horizontal line while genes with higher binding levels in S2 cells are shown as orange bars below the line. The widths of the bars reflect the gene length. The relative change in expression is shown below the gene annotation map (the zfh2 gene is indicated). Genes that are more expressed in salivary glands are shown as dark gray bars above the horizontal line, and genes that are more expressed in S2 cells are shown as light gray bars below the horizontal line. Note that the POF binding differences are reflected by the differences in expression.

