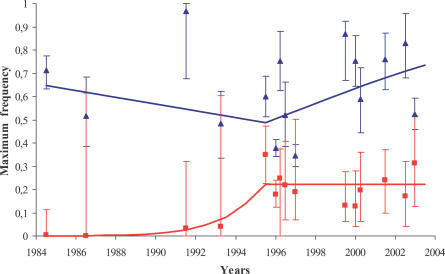
Figure 1. Time Variation of the Different Alleles' Maximum Frequency.
The evolution of the maximum frequency (coastal frequency) for each ace-1 resistance allele estimated from the descriptive model is presented. The blue triangles and red squares represent, respectively, the maximum frequency of R and D (= D2 + D3) estimated for each cline independently (blue and red bars represent the confidence intervals, respectively), the blue and red lines representing the frequency estimated from the complete dataset conjointly (see text). Note that no tools are currently available to distinguish D2 and D3 in the field, only their total frequency being thus estimated (see Materials and Methods).

