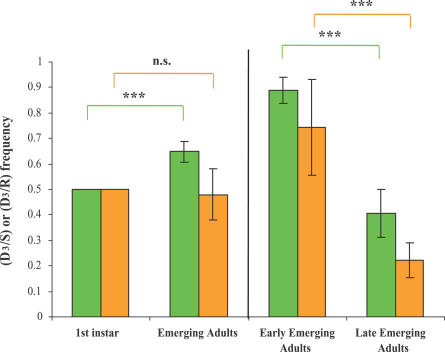
Figure 4. Frequency of Heterozygotes (D/S) and (D/R) Compared to Homozygotes (R/R) during Development.
The frequency of (D/S) and (D/R) individuals is indicated on the left for two developmental stages, first instar and emerging adults. On the right, emerging adults are divided into early and late emerging adults. (i) (D3/S) versus (R/R) (green), (ii) (D3/R) versus (R/R) (orange). The bars indicate one error-type. Significant frequency differences between the different stages are indicated (n.s., p-value > 0.05; *, p-value < 0.05; **, p-value < 0.01; and ***, p-value < 0.001).

