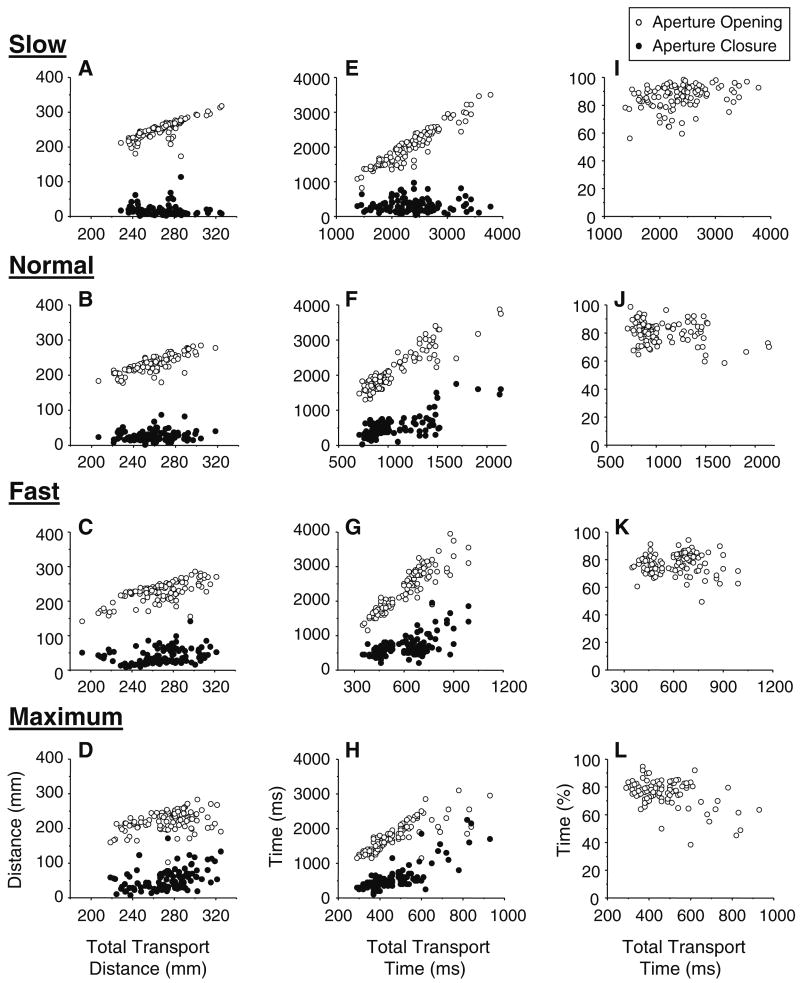
Fig. 4.
Aperture opening distance (open circles) and closure distance (filled circles) are plotted against the total hand transport distance (a–d) across all trials for all subjects for each condition. Similarly, aperture opening time (open circles) and closure time (filled circles) are plotted against the total hand transport time (e–h), and normalized aperture opening time (open circles) is plotted against the total hand transport time (i–l). Each speed condition is plotted separately (Slow: a, e, i; Normal: b, f, j; Fast: c, g, k; Maximum: d, h, l). The data are from the far target condition

