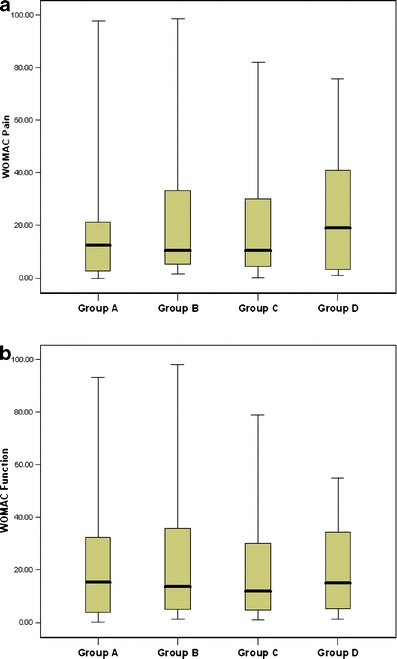
Fig. 3.

Association between WOMAC pain (a) or function (b) scores and bone marrow edema-like lesions. Group A: patients with no bone marrow edema-like lesions; Group B: patients in whom bone marrow edema-like lesions did not change over 2 years; Group C: patients in whom bone marrow edema-like lesions increased in size over 2 years; Group D: patients in whom bone marrow edema-like lesions decreased in size over 2 years. Box plots show the median, interquartile range, minimum and maximum values
