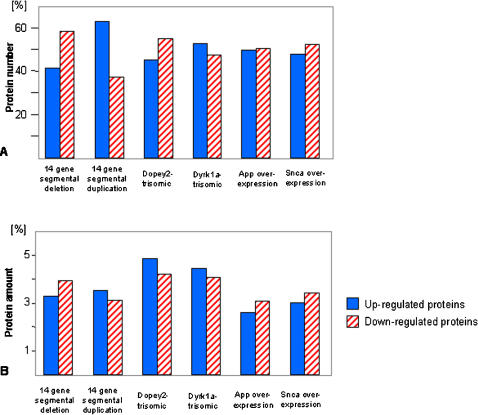
Figure 2. Proteins that showed altered expression in transgenic ES cell lines.
(A) Number of altered proteins in each transgenic cell line, expressed as percentile of total number of altered proteins. (B) Amount of proteins that underwent altered expression in each cell line, represented as percent of total spot volume that was up or down-regulated in transgenic cell lines. Dose alteration of 14 genes could no longer be balanced by an equivalent number of variant proteins. However, a balance remained at the level of protein concentration.

