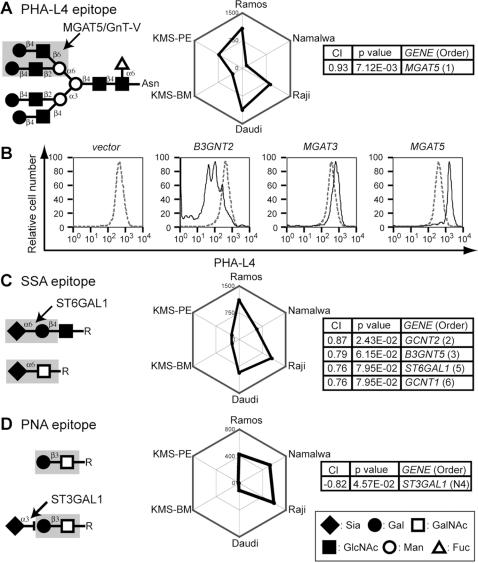
Figure 2. CIRES analyses of staining profiles obtained using lectins with known epitope expression-regulating enzymes.
(A, C, D) Expected glycan structures for lectin recognition (left), web graphs of the lectin staining profiles (depicted as polygons) obtained using a set of six B-cell lines (middle), and the correlation indexes (CI, Pearson's correlation coefficient for profile matching) of the relevant genes that correlated with the plant lectin staining profiles and the P values of the correlations (right). The correlation orders of the glycan-related genes selected from the complete list of correlated genes (Table S2) are indicated as numbers in parentheses in the box for each gene, with a smaller number indicating a stronger correlation between gene expression and glycan expression profiles. Genes with a negative correlation are indicated by an N before the order number. The lectins used were (A) PHA-L4, (C) SSA, and (D) PNA. Lectin epitopes shown in the figures are taken from the literature unless otherwise specified [17], [51]. (B) Namalwa cells were infected with MSCV harboring MGAT5-IRES-EGFP. Control cells were infected with empty vector (IRES-EGFP) or the same vector encoding B3GNT2 or MGAT3. Flow cytometry results for PHA-L4 staining were compared between EGFP-positive cells (solid line) and EGFP-negative cells (dashed line).

