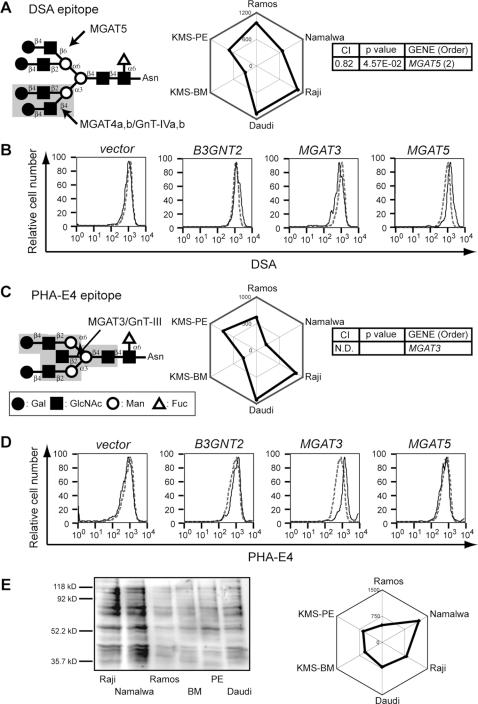
Figure 4. CIRES analyses of staining profiles obtained using lectins that recognize internal glycan structures and have unknown epitope-expression-regulating enzymes.
Presentation is the same as in Fig. 2 except that the plant lectins used were (A, B) DSA and (C–E) PHA-E4. N.D. in the gene order list indicates that no significant correlation was detected. (B, D) Flow cytometric staining patterns for EGFP-positive Namalwa cells are shown in bold lines, and those for EGFP-negative (control) cells are shown in gray dashed lines. The overexpression of MGAT5 resulted in a subtle (60%) increase in DSA staining. The overexpression of MGAT3 resulted in a 2-fold increase in PHA-E4 staining. (E) PHA-E4 lectin blotting was performed using the membrane fraction of the same set of cell lines. A plot of the quantified signals reveals differences in the PHA-E4 staining profile among the six cell lines (C, E), as discussed in the text.

