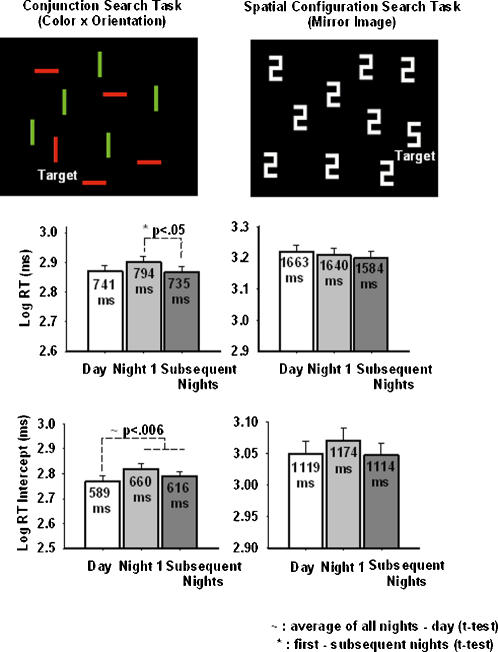
Figure 1. Stimuli and Response Time Data from the Visual Search Tasks.
The top panels show a representative target present trial in the two search tasks. The top left panel shows a conjunction search trial where the target is a red vertical bar and the distractors, green vertical and red horizontal bars. The top right panel shows a spatial configuration search trial where the target a white block numeral ‘5’, and the distractors, the mirror image white block numeral ‘2s’. The middle and lower panels show the log transformed RT and the RT x set size intercept results. In the middle and lower panels, the x-axis represents the work shift. In the middle panels the y-axis represents RT and in the bottom panels it represents the RT intercept, both in log units. The error bars represent the standard error of the mean. The day shift (baseline) data are shown in the white bar and represent the average of the third and fourth day shifts (the first two shifts were excluded to minimize practice effects; see text for details); night 1 data are shown in the light gray bar; data from the ‘subsequent’ nights are shown in the dark gray bar, and represent the average of the second and third night shifts. The middle panels show RT data from the two search tasks. As seen in the left panel, RT was slowest on the night 1 in the conjunction search task, while the right panel indicates that this slowing did not occur in the spatial configuration search task. The lower panels show RT x set size intercept data from the two search tasks. As seen in the left panel RT intercept during night work was significantly slower than during day work in the conjunction search task (t-tests).

