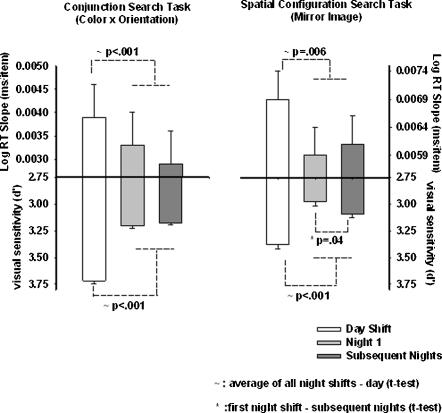
Figure 2. Speed/Accuracy Trade Off in Selective Attention.
The data in this figure represent the slopes of the RT x set size function (index of selective attention) in log units and d' (an index of sensitivity reflecting accuracy) in the visual search tasks. The error bars represent the standard error of the mean. As in figure 1 the x-axis represents the work shift. In the upper part of the figure the y-axis represents RT slope in (msecs per additional item). In both search tasks, the decreasing values of RT slope during night work suggest that there was either a speed-up in search with increasing number of items or there was a failure in processing information arising from nocturnal cognitive impairment. In the lower part of the figure the y-axis represents d'. Decreasing values of d' during night work in both search tasks indicate a loss of accuracy. In the spatial configuration search task (right panel) this loss of accuracy was greatest on the first night shift. Together the results presented in this figure suggest a speed-error trade-off on the night shifts, indicating that participants either failed to collect sufficient information or there was a failure in processing information arising from nocturnal cognitive impairment.

