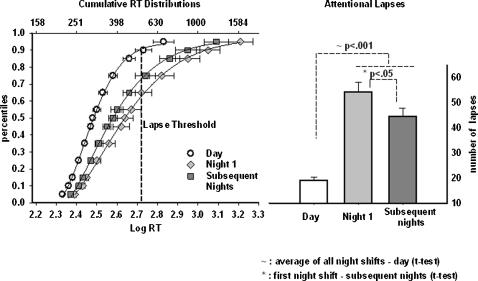
Figure 3. The Impact of Night Work on Vigilance RT and Attentional Lapses.
This figure presents results from the PVT task. The left panel represents the group-averaged cumulative response time (RT) percentile distribution. The x-axis represents response time with the bottom x-axis in log units and the top x-axis in milliseconds. The error bars represent the standard error of the mean. The dashed vertical line is plotted at the average attentional lapse threshold (90th percentile of baseline RT). The y-axis represents percentile points. The average cumulative distributions were computed by calculating the RT percentiles for the day (open circles), first night shift (filled diamond) and ‘subsequent’ night shifts (filled square) for each individual subject, and then averaging them across subjects to compute the final cumulative distributions. For each of the shifts, these cumulative distributions were fitted with a 4-parameter Weibull function. The right panel presents the number of attentional lapses on the three shifts. The error bars represent the standard error of the mean. There was a significant increase in lapses during night work, and this was most pronounced on the first night shift.

