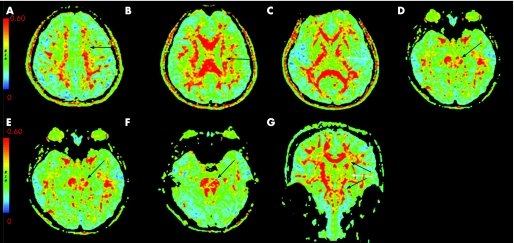
Figure 2 An example of diffusion tensor images obtained from the same patient as in fig 1. From the axial fractional anisotropy (FA) images (A–F), reduced FA signals are observed not only at the primary lesion (C, white arrow) but in the fibre tract above the primary lesion including the centrum semiovale and coronal radiata (A, B, black arrows), and below the primary lesion including the cerebral peduncle, pons and medulla ipsilaterally (D–F, black arrows). In (G), a coronal view shows the reduced FA signals at the infarct region (white arrow) and in the fibre tract proximal and distal to the infarct lesion (black arrows).

An official website of the United States government
Here's how you know
Official websites use .gov
A
.gov website belongs to an official
government organization in the United States.
Secure .gov websites use HTTPS
A lock (
) or https:// means you've safely
connected to the .gov website. Share sensitive
information only on official, secure websites.
