
FIGURE 3.
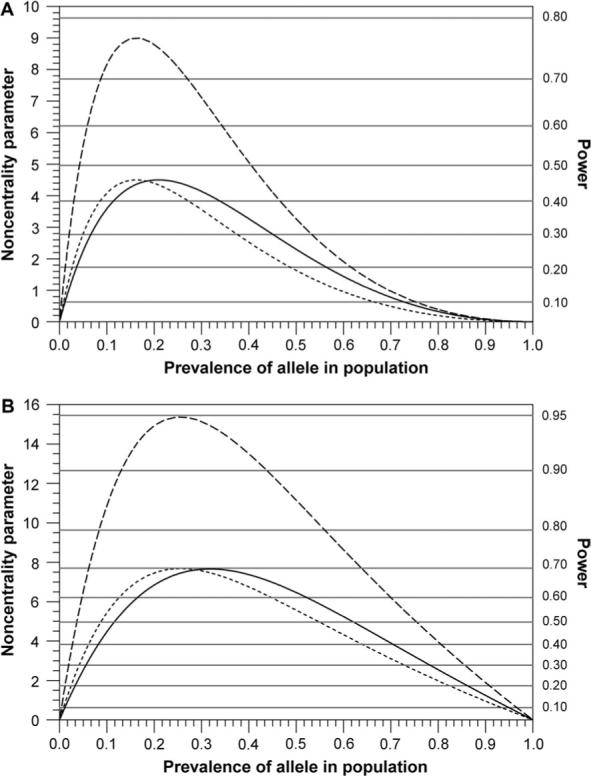
Noncentrality parameter (left y-axis) and associated power (right y-axis) as a function of allele prevalence for a 2-degrees-of-freedom chi-square likelihood ratio test for interaction effects. The interaction risk scenario: R1 = 1.5, R2 = 3.0, T = 1, U1 = U2 = 2.0, with exposure prevalence fixed at 0.15. Calculations assume a nested case-control study with 400 cases and 800 controls within a risk-based cohort (short-dash line) or a randomly sampled cohort (solid line). An example curve corresponding to doubled accrual within the risk-based cohort, based on 800 cases and 1,600 controls, is also shown (long-dash line). Noncentrality is based on A) a multiplicative null model for no interaction, and B) an additive null model for no interaction. Parameters R1 and R2 denote the relative risks for offspring with one and with two copies of the variant allele, respectively, relative to those with no copies. The parameter T is the relative risk associated with exposure. U1 and U2 are the multiplicative interaction parameters for exposure acting jointly with one and with two inherited copies of the allele, respectively.