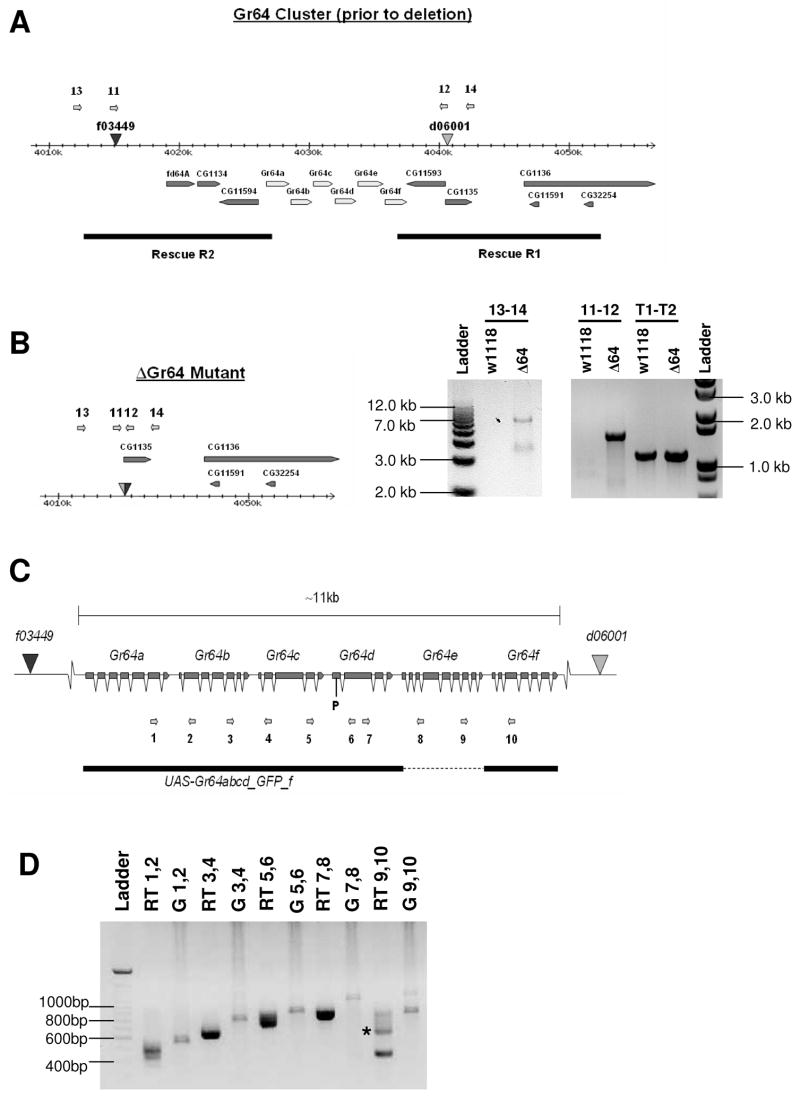
Figure 1. Generation of a Gr64 mutant strain (ΔGr64) and RT-PCR expression analysis of the six Gr64 genes.
(A) Diagram of the Gr64 gene cluster. The positions of the piggyBac transposons are indicated by triangles. The diagram shows the Gr64 cluster prior to generation of the deletion line. The numbered arrows indicate the positions of the primers used for PCR analysis of the deletion. The black bars represent the rescue constructs for the genes flanking the Gr64 cluster.
(B) Molecular analysis of ΔGr64 mutant strain. The diagram shows the structure of the Gr64 deletion (ΔGr64) after trans-recombination. Genomic DNA from w1118 flies was also analyzed for comparison. Expected band sizes are as follows: 1.1 kb for primers T1 and T2, 1.5 kb for primers 11 and 12, and 6.9 kb for primers 13 and 14. Relevant band sizes from the ladder are marked along the sides of the gel. The 1.5 and 6.9 kb products were cloned and sequenced to further confirm the presence of the deletion. The 1.1 kb product is derived from the tubulin gene and serves as a control for DNA integrity.
(C) Exon-intron structure of the Gr64 cluster. Exons are represented by boxes and introns by v-shaped lines. The numbered arrows show the positions of the primers used for RT-PCR analysis. The black bar indicates the rescue construct (UAS-Gr64abcd_GFP_f) in which Gr64e was replaced by EGFP (indicated by the dashed line).
(D) RT-PCR of total RNA from fly heads indicates the presence of polycistronic transcripts in the Gr64 cluster. RNA was extracted from wild-type ORE-R flies. Each pair of primers spans at least one intron in each of the two genes being investigated. For each pair of primers used in an RT-PCR reaction, a corresponding PCR reaction was performed on genomic DNA to provide a size comparison. RT-PCR products were isolated for each primer pair, cloned and sequenced to confirm integrity of appropriately spliced cDNA products. RT-PCR from leg tissue showed similar results (data not shown). Lanes marked “RT” represent RT-PCR products, while lanes marked “G” represent PCR products from genomic DNA.

