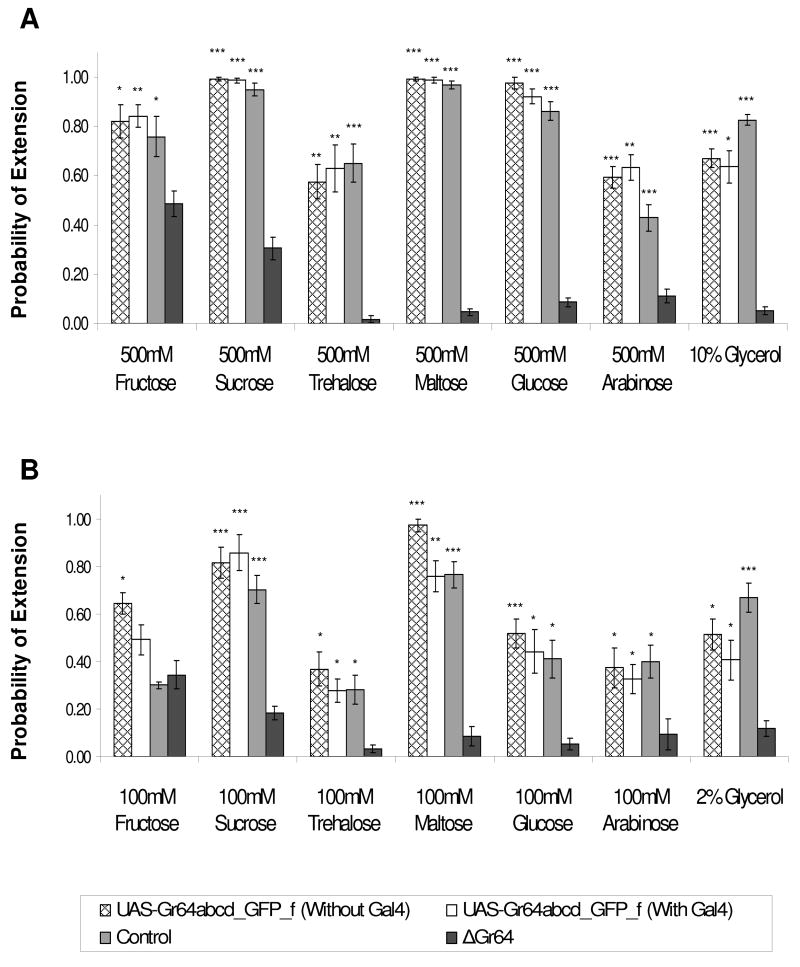
Figure 3. Rescue of ΔGr64 mutant phenotype.
PER response of ΔGr64 mutants (R1/+;R2/+;ΔGr64/ΔGr64) carrying one copy of the UAS-Gr64abcd_GFP_f reporter, with or without Gr5a-Gal4 driver. Sugars were tested at 500mM (A) and 100mM (B) concentration. PER response of flies with the rescue construct is similar to that of the control flies, regardless of whether or not the Gr5a-Gal4 driver is present. Each graph is the average of 4–15 experiments +/− SEM (3–11 flies per experiment, 20–105 flies total for each strain and tastant tested). Asterisks indicate a significant difference between the mutant and control strains, as determined by Student’s t-test (* indicates p<0.05, ** indicates p<0.001, *** indicates p<0.0001).

