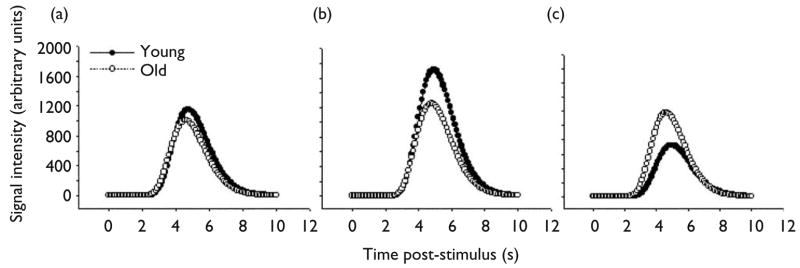
Fig. 1.
Models of hemodynamic response during inhibition for both young and older adults in the three largest activation clusters: right inferior parietal lobule (a), right middle frontal gyrus (b) and left inferior/middle frontal gyrus (c). The plotted symbols are for visual distinction only and do not represent actual datapoints. The groups did not significantly differ on any parameter in these clusters except in magnitude for c (old > young, p ≤ 0.01; see Table 1).

