
Fig. 2.
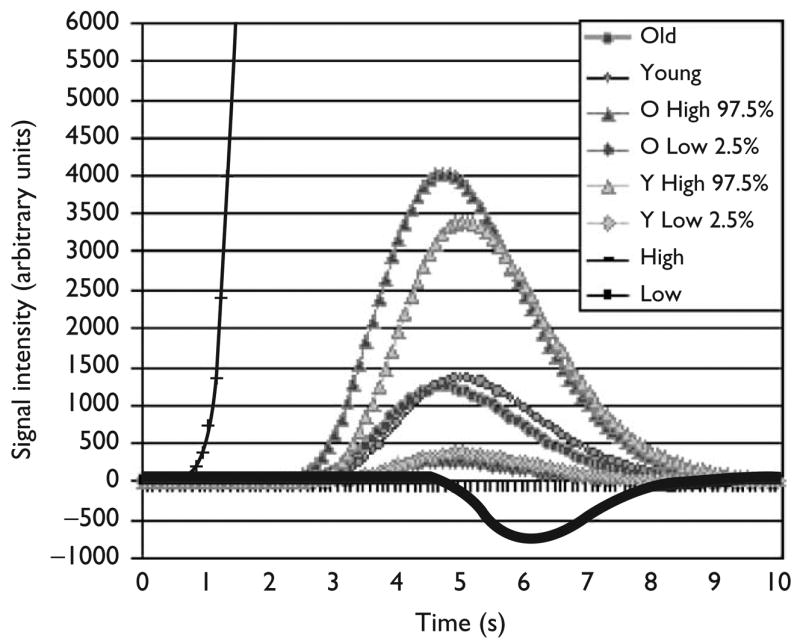
Models of hemodynamic response during inhibition averaged across the 10 largest clusters, separately for older and younger participants, including confidence intervals and high and low parameters. The plotted symbols are for visual distinction only and do not rep resent actual datapoints. The averages were comparable between groups.