
Fig. 2.
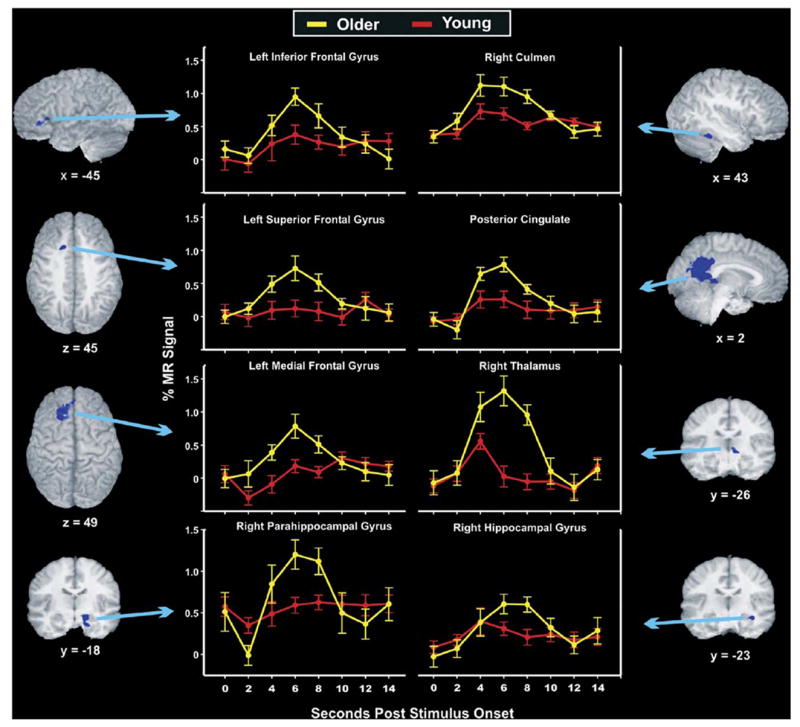
Eight of the 15 regions that showed significant age group differences in the estimates of the hemodynamic response (area under the curve for 4–8 s post-stimulus) are depicted with anatomical localization and full time-course, group averaged impulse response functions for Recent famous names. In all significant analyses, older participants had greater activation than younger participants, which occurred predominantly for the Recent condition as compared with Foils (see Table 3 and Fig. 3).