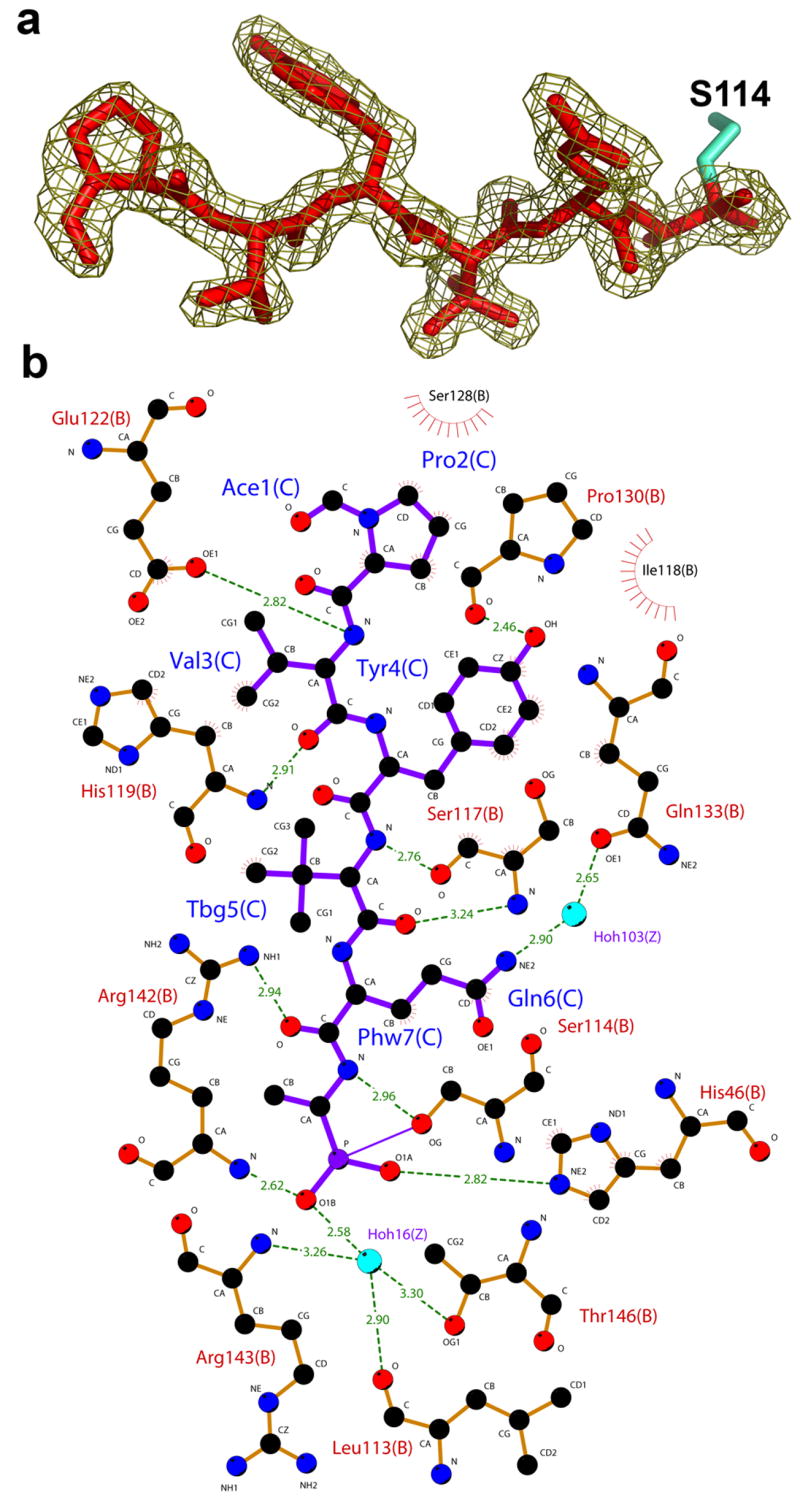
Figure 2.

Interactions of the hexapeptide transition state analogue with KSHV protease. (a) The 2fo–fc electron density map of the inhibitor at contour level of 1σ. (b) A Ligplot 50 representation of the interactions between inhibitor (purple) and protease residues (orange). Water molecules are colored in blue, protease residues that are involved in hydrogen bonds are shown in ball and stick representation and hydrogen bonds are represented with dashed green lines. Residues that are involved in hydrophobic contacts are labeled with radial lines facing their contact residue.
