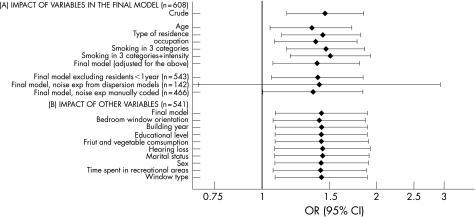
Figure 2 Odds ratios (OR) and 95% confidence intervals (CI) for hypertension associated with a 5 dB(A) increase in exposure to road traffic noise. (A) The individual and total confounding effect on the point estimate from the variables included in the final model; (B) the additional confounding effect from variables not included in the final model.

An official website of the United States government
Here's how you know
Official websites use .gov
A
.gov website belongs to an official
government organization in the United States.
Secure .gov websites use HTTPS
A lock (
) or https:// means you've safely
connected to the .gov website. Share sensitive
information only on official, secure websites.
