
Figure 4.
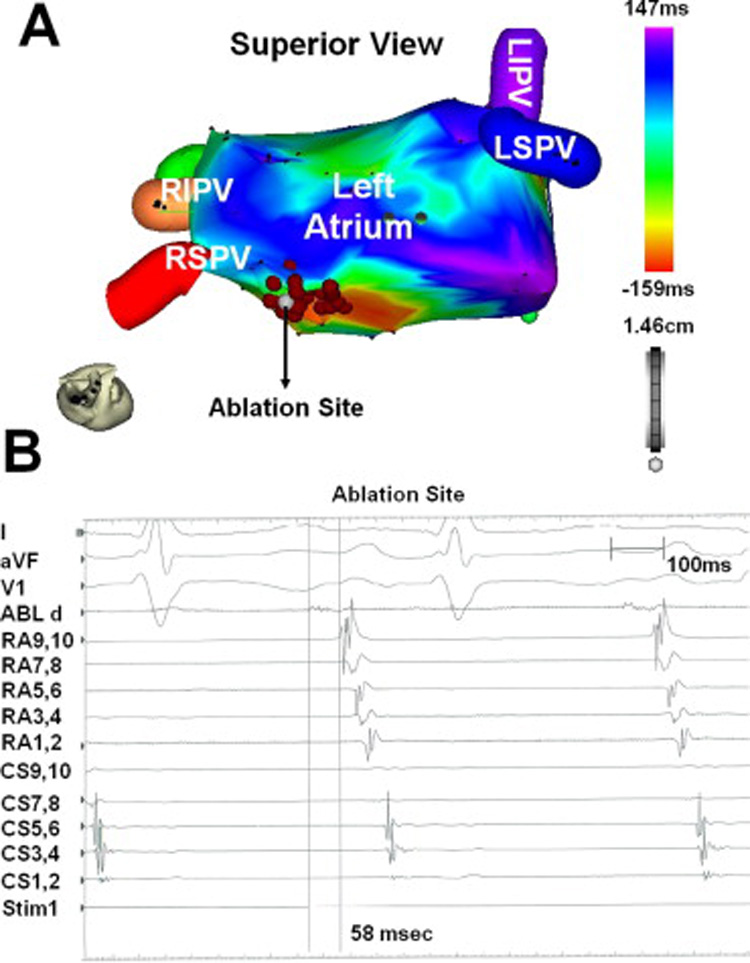
Electroanatomic isochrone map and multichannel intracardiac electrograms. Panel A is the left atrial electroanatomic isochrone map. The white marker (arrow) identifies the ablation site that successfully terminated the atrial tachycardia. The red markers are sites where RF energy was applied circumferentially around the site of earliest activation. Panel B is the multichannel endocardial electrogram recording prior to successful ablation, with the ablation catheter at the superior left atrium, near the activation site predicted by ECGI. Surface leads I, aVF, and V1 are followed by intracardiac recordings from the ablation catheter, a decapolar catheter located on the lateral wall of the right atrium, and a decapolar catheter positioned in the coronary sinus (proximal to distal). The ablation catheter measured spontaneous diastolic potentials 58 msec prior to the onset of the surface P wave.