
Fig. 5.
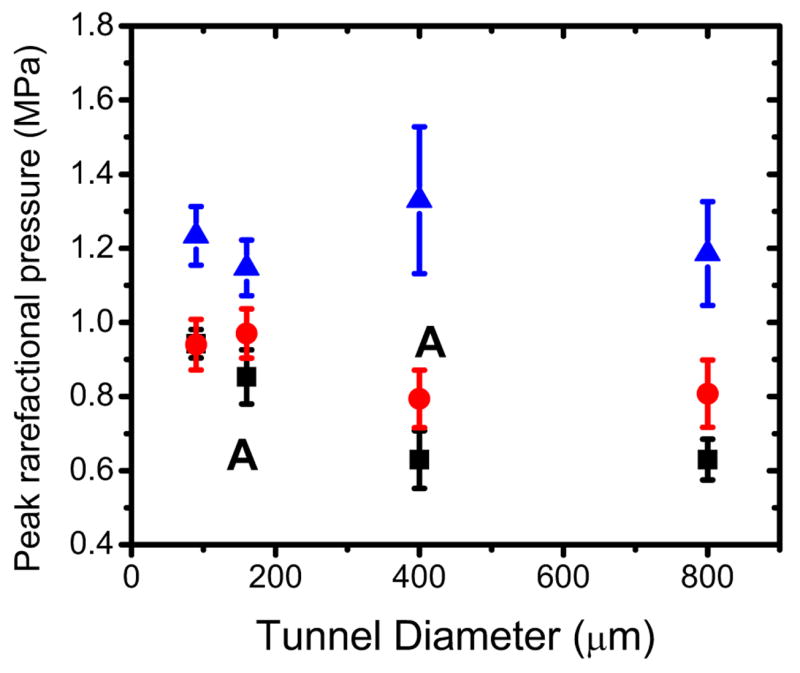
IC threshold for broadband noise emission as a function of the tunnel diameter for 1.2% Optison concentration (squared dots) and the 0.2 % concentration (circle dots). The tunnels were insonated in the center location. Control data are shown also in the figure (triangle dots). The letter A indicates about the same amount of bubbles in the volume V.