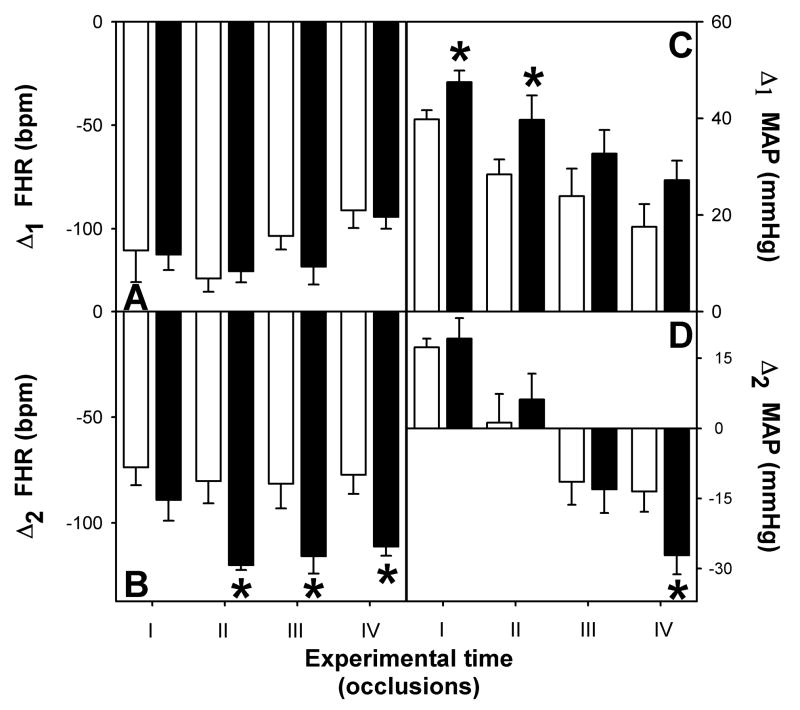
Figure 2.
Magnitude of the fetal heart rate changes during the first minute (A) and during the last minute (B) and magnitude of the arterial blood pressure changes during the hypertensive phase (C) and during the last minute (D) of umbilical cord occlusion. Control (□, n=7) and pre-existing hypoxia (■, n=8) group. Values are mean±SEM, * p<0.05.

