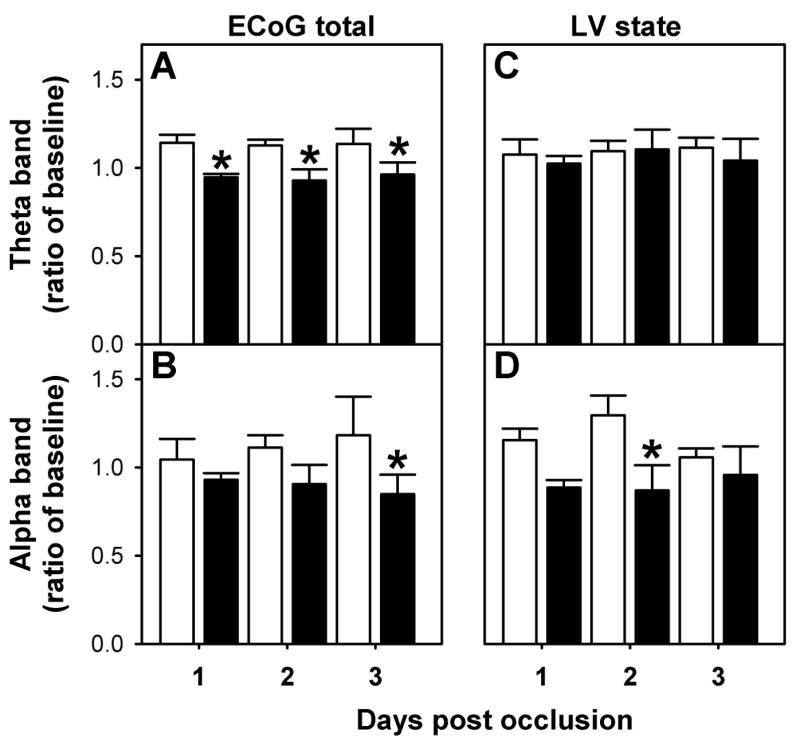
Figure 5.

Power Spectrum Analysis of fetal ECoG in the days following the occlusion period. Relative spectral power of Theta (A) and Alpha (B) bands for total ECoG and in the low voltage state Theta (C) and Alpha (D). Control (□, n=5) and pre-existing hypoxia (■, n=6) group, *p<0.05 by ANOVA.
