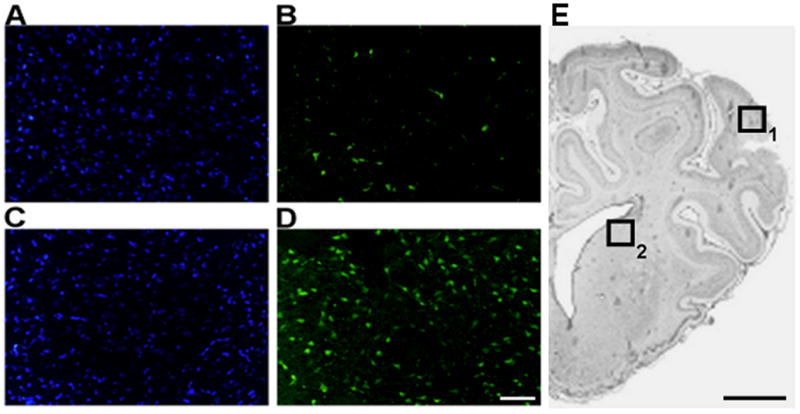
Figure 6.

Representative microphotographs of DAPI (A, B) and Fluoro Jade-B (C, D) staining in basal ganglia sections of control (A, C) and pre-existing hypoxia (B, D) fetuses brain. Bar = 50 μm. Low resolution microphotograph showing the areas (boxes) used to measure cortical (1) and striatal (2) neuronal damage (E). Bar= 5 mm
