


FIGURE 1.
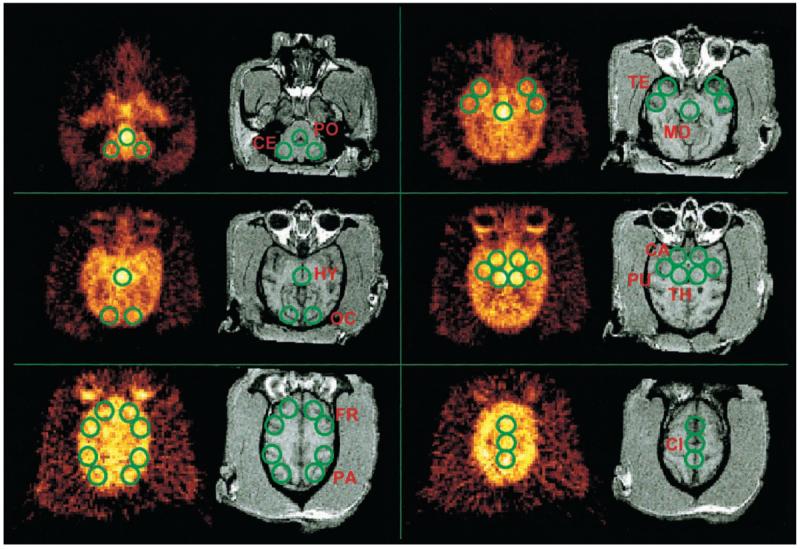
Registered PET 11C-DASB and MR images of control baboon brain with superimposed ROIs used for derivation of time–activity curves. PO = pons; CE = cerebellum; TE = temporal cortex; MD = midbrain; HY = hypothalamus; OC = occipital cortex; CA = head of caudate; PU = putamen; TH = thalamus; FR = frontal cortex; PA = parietal cortex; CI = cingulate gyrus.