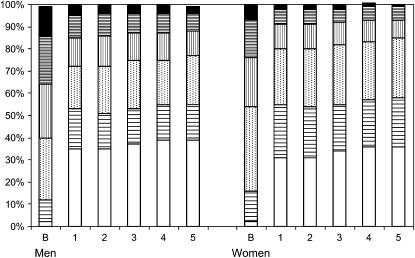
Figure 2.
Smoking category at baseline and each follow-up year. The figure shows the proportion of subjects in each smoking intensity category at baseline (B) and each follow-up year. The lower segment of each bar (no fill) represents the % of nonsmokers (solid black segment). The segments above sequentially represent smoking category by cigarettes/day: 1–15 (horizontal bars); 16–25 (dots); 26–35 (vertical bars); 36–45 (dense horizontal bars); 46 or more (solid black).

