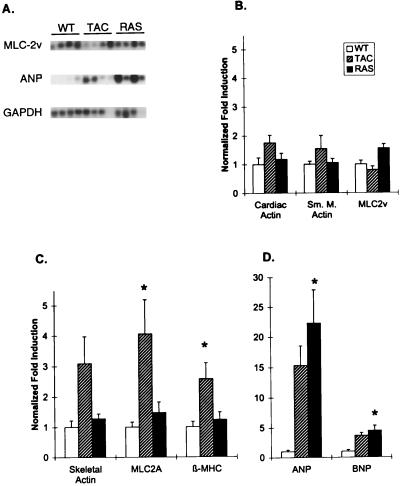
Figure 3.
Northern blot analysis. (A) Representative Northern blot showing probes for ANP, MLC2v (n = 4), and GAPDH (each lane represents RNA from one animal). (B) Fold induction (over WT) of mRNAs for cardiac α-actin (n = 7, 11, 8), smooth muscle α-actin (n = 7, 12, 8), and MLC2v (n = 7, 11, 8) (corrected for differences in loading using GAPDH signal). (C) Fold induction of mRNAs for skeletal α-actin (n = 16, 17, 12; includes an additional group of animals not analyzed by echocardiography), MLC2a (n = 7, 7, 7), and β-MHC (n = 7, 8, 8). (D) Fold induction of ANP (n = 11, 8, 7) and BNP (n = 7, 7, 7). Note that n = WT, TAC, and RAS values respectively. Data are mean + SEM; ∗, P < 0.05 vs. WT.

