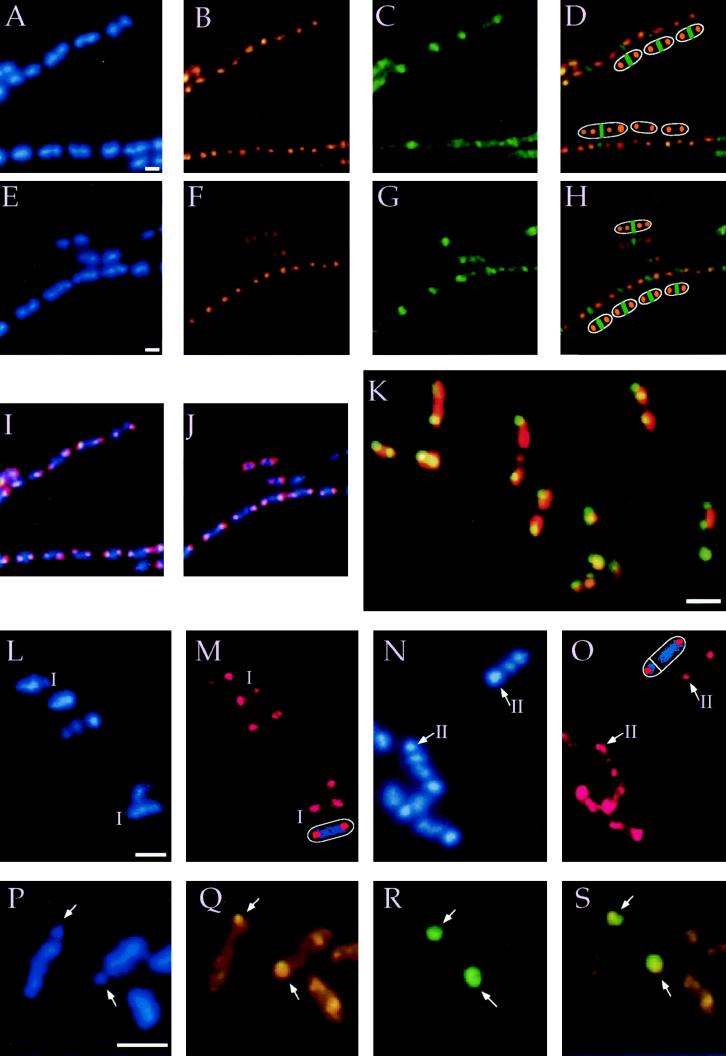
Figure 1.
Localization of Spo0J during growth and sporulation. (Bars ≈1 μm.) (A–J). Growth in minimal medium. A–D and I represent one field of cells, and E–H and J a different field of cells. (A and E) DAPI staining to visualize nucleoids (blue). (B and F) Immunostaining of Spo0J with affinity-purified rabbit antibodies and secondary antibodies coupled to the fluorophore Cy-3 (orange). (C and G) Immunostaining of FtsZ with affinity-purified chicken antibodies and secondary antibodies coupled to the fluorophore fluorescein isothiocyanate (green). (D) Overlay of exposures of Spo0J (B) and FtsZ (C). Cartoons of six cells are indicated. The three cells at the top of each panel have an FtsZ ring with a single site of Spo0J staining per nucleoid (class 3 of Fig. 2). Of the three cells at the bottom, the large cell to the left has an FtsZ ring with a nucleoid on each side and two sites of Spo0J per nucleoid (class 4 of Fig. 2). The other two cells have no FtsZ ring and a single nucleoid with two sites of Spo0J (class 2 of Fig. 2). (H) Overlay of exposures of Spo0J (F) and FtsZ (G). Cartoons of five cells are indicated; all have FtsZ rings. The large cell at the top has two sites of Spo0J per nucleoid (class 4 of Fig. 2), while all of the cells at the bottom have one site of Spo0J per nucleoid (class 3 of Fig. 2). (I) Overlay of exposures of DAPI (A) and Spo0J (B). (J) Overlay of exposures of DAPI (D) and Spo0J (E). (K) Spo0J–GFP localizes to the nucleoids in a bipolar manner. Living cells were stained with 7-amino-actinomycin D to visualize the DNA (red). Endogenous fluorescence from Spo0J–GFP appears yellow when it completely overlaps with the red from the DNA. (L–O) Localization of Spo0J during early stages of sporulation in wild-type cells. Cells were stained with DAPI (blue) to visualize DNA (L and N), and immuno-stained (red) to visualize Spo0J (M and O). (L and M) Three cells are at stage I, indicated by “I,” and a sketch of one of these is shown in M. (N and O) Arrows point to the condensed forespore nucleoids from two different stage II sporangia (II). A sketch is shown of one of these at the top of O. (P–S) Spo0J colocalizes with the origin-proximal 30% of the chromosome in the forespore of a spoIIIE mutant. Two sporangia of the spoIIIE mutant stained with DAPI (blue) to visualize DNA (P), and immunostained for Spo0J (orange) (Q), and β-galactosidase (green) (R). β-Galactosidase is produced from the sspE(2G)–lacZ fusion that is expressed only in the forespore. The fusion is in the origin-proximal part of the chromosome that gets trapped in the forespore in the spoIIIE mutant. (S) Overlay of the Spo0J and β-galactosidase staining. Arrows indicate the forespore. Note that in contrast to wild-type sporangia (N) that have highly condensed forespore nucleoids, the spoIIIE mutant forespore (P) has much less staining, reflecting the absence of a complete chromosome.

