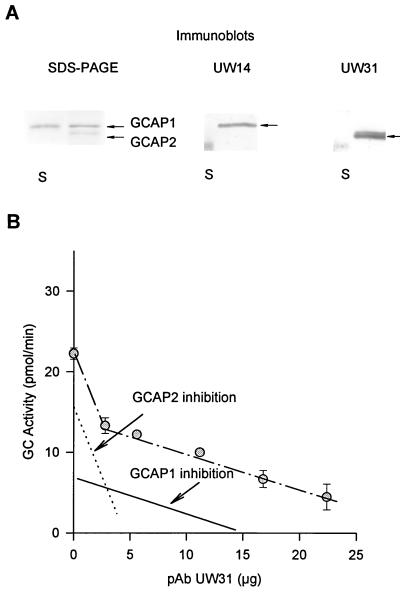
Figure 6.
Inhibition of GC activity in ROS. (A) SDS/PAGE and immunoblots of GCAP1 and GCAP2 isolated from a retinal extract. UW14 was specific for GCAP1, and UW31 was specific for GCAP2. S represents molecular markers at 20 kDa. Note that GCAP2 appears in two molecular forms of the unknown origin and that UW31 does not recognize GCAP1. (B) The inhibition of GC activity in ROS homogenates. The GC assay was performed as described by Gorczyca et al. (4). Dotted line was determined experimentally from the inhibition of GCAP2-dependent stimulation of GC in reconstituted systems composed of purified GCAP2 (2 μg) and washed ROS membranes. Solid line was determined experimentally from the inhibition of GCAP1-dependent stimulation of GC in reconstituted systems composed of purified GCAP1 (6 μg) and washed ROS membranes.The amount of GCAP1 or GCAP2 (studied in the range of GC stimulation between 5 and 80 pmol/min) did not affect the slope (GC activity versus antibody concentration) of these inhibitions.

